For most of the last decade, “site performance matters for SEO” has been a refrain SEO consultants repeated without much specificity. It was true in the directional sense — yes, faster sites tended to rank better — but the relationship was loose enough that you could ignore it and still rank fine. That window closed quietly between 2023 and 2025. By 2026, performance is no longer a secondary ranking signal. For competitive search terms, it’s a primary one. And most sites we audit are failing at it badly enough that performance alone is keeping them off page one.
This is genuinely under-recognised. We see well-resourced businesses spending five-figure monthly retainers on content marketing while their site loads in five seconds, and wondering why the rankings aren’t moving. The content might be excellent. The technical SEO might be solid. But Google ranks based on what users experience, and if half of mobile visitors are bouncing before the page finishes loading, no amount of content marketing is going to overcome that signal.
What Google is actually measuring
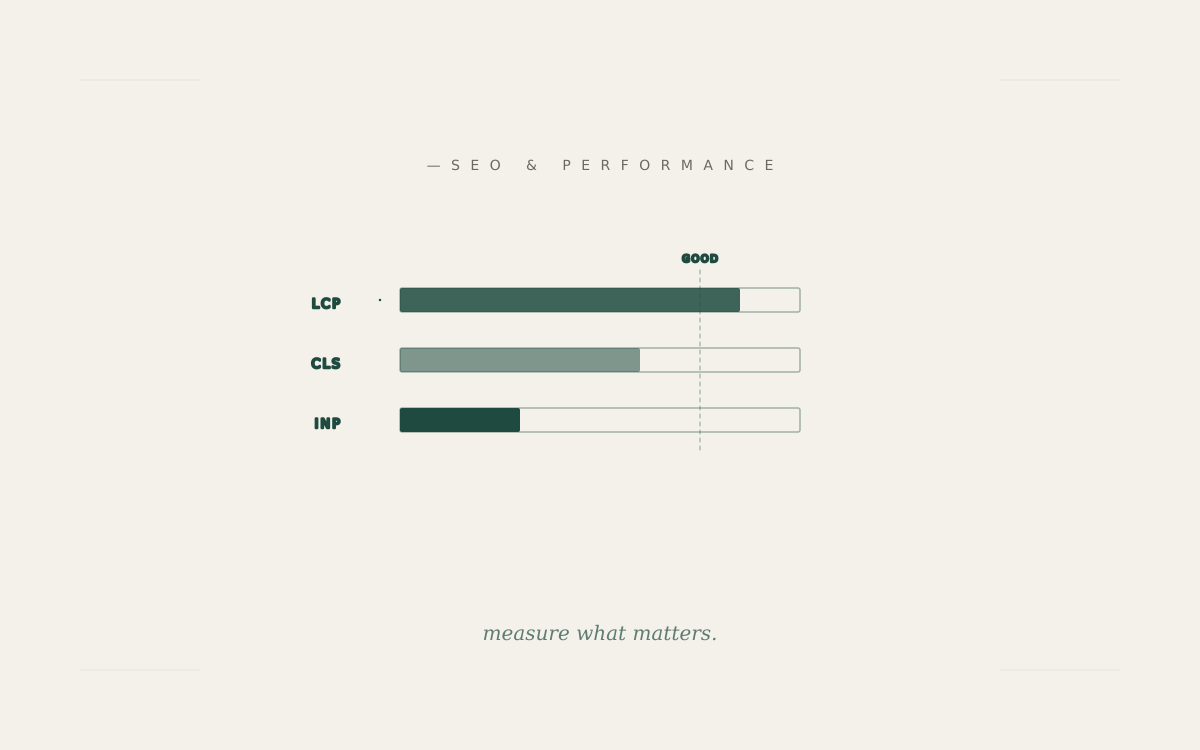
The metrics that matter are formalised under a framework Google calls Core Web Vitals. Three measurements, each with thresholds that determine whether a page passes or fails.
Largest Contentful Paint (LCP) measures how long it takes for the largest visible element on a page to render. The threshold for “good” is 2.5 seconds. Most of the sites we audit are at 4 to 6 seconds. The cause is usually a hero image that’s too large, a custom font that’s blocking initial render, or a third-party script that’s delaying the main content from loading.
Cumulative Layout Shift (CLS) measures how much elements on the page jump around as they load. The threshold for “good” is a CLS score below 0.1. Sites with banner ads, late-loading images without explicit dimensions, or fonts that swap from a fallback to a webfont commonly score 0.3 or higher — visibly bad to users, and Google treats it accordingly.
Interaction to Next Paint (INP) replaced First Input Delay in 2024. It measures how long it takes the page to respond when a user clicks or taps something. Threshold for “good” is under 200ms. Sites with heavy JavaScript bundles — especially React or Vue applications without code splitting — frequently score 500ms or worse, which feels sluggish and registers as such.
A page passes Core Web Vitals when all three metrics are in the “good” range. Critically, Google measures this on real user data (not synthetic Lighthouse scores, though Lighthouse is a useful approximation). The data comes from Chrome users with telemetry enabled — which is most of them — meaning Google has actual field data on how slow your site really is in real-world conditions.
Why this matters more in 2026 than it did in 2022
Three things changed between the start of the decade and now.
First, Google’s algorithm got more sensitive to Core Web Vitals signals. The 2021 Page Experience Update introduced these as ranking factors, but the weighting was modest. Subsequent algorithm updates — particularly the August 2024 Core Update and the March 2025 Helpful Content Update — increased the weighting substantially. We’ve seen sites with strong content drop ten ranking positions on competitive terms after a Core Web Vitals regression, and recover within weeks of fixing it.
Second, the competitive baseline shifted. In 2022, plenty of sites in any given niche had bad Core Web Vitals, so being merely mediocre on performance was survivable. By 2026, the major players in most categories have invested in performance, which means the bar is higher. Sites that were below average in 2022 are now substantially below average — and Google has more comparison data to know it.
Third, mobile traffic became dominant. For most B2C categories, mobile is now 65 to 80 percent of traffic, and Google indexes the mobile version of your site by default. Performance on mobile is much harder than on desktop because mobile devices have less CPU, less memory, and slower network connections. A site that scores well on desktop and badly on mobile is being judged on the mobile score, and most of those gap discrepancies are wide enough to drop rankings noticeably.
The cost of failing at performance
Quantifying this is tricky because of confounding factors, but we have decent estimates from our own client work and from public studies.
For competitive commercial keywords, dropping out of the “good” range on Core Web Vitals correlates with a drop of three to eight ranking positions on average. For terms you’re already ranking 11th to 20th on, that’s enough to fall off page two entirely. For terms you’re 4th to 10th on, you’re losing a meaningful chunk of click-through-rate even without falling off the first page.
Beyond rankings, performance hits conversion rates directly. Industry studies have consistently found that every additional second of load time correlates with a conversion rate drop of 5 to 20 percent, depending on category. So a site that takes 5 seconds to load instead of 2 is losing perhaps 30 percent of conversions on top of its ranking penalty. The compound effect is large, and it’s invisible because most analytics dashboards don’t show “users who would have converted if the site had loaded faster.”
Why most sites fail at performance
The reasons are predictable, and they’re almost always self-inflicted.
Too many marketing scripts. The single biggest performance killer on most sites is the accumulation of marketing tags: Google Analytics, Facebook Pixel, Google Tag Manager (which loads more tags), heatmap tools, A/B testing platforms, customer-support widgets, exit-intent popups. Each one individually seems harmless. Together, they often add 1 to 3 seconds to page load and double the JavaScript execution time. Most sites have at least three scripts loaded that nobody on the team can identify the purpose of.
Stock theme bloat. Pre-built themes from theme marketplaces are usually built to maximise feature flexibility, not performance. They include CSS and JavaScript for every possible feature even on pages that don’t use those features. The result: a homepage loads 800kb of CSS and 1.2mb of JavaScript when the page itself uses about 60kb of each.
Hero images that aren’t optimised. A surprising percentage of slow sites are bottlenecked by their hero image. The image is uploaded at 4000px wide, served as a JPEG instead of WebP, and isn’t optimised for the actual viewport. Modern image formats and responsive image handling can reduce this image’s file size by 80% with no visible quality loss.
Third-party fonts blocking render. Loading custom webfonts is fine; loading them in a way that blocks initial page render is not. Many sites use the default browser-blocking font load behaviour (FOIT — Flash of Invisible Text) which means the page is invisible until the fonts download. The fix — font-display: swap plus preloading critical fonts — is a one-line change that most themes don’t implement.
Bloated WordPress installations. WordPress sites compound the problem because every plugin adds CSS, JavaScript, and database queries. A site with 30 active plugins is shipping the kitchen sink to every visitor on every page. Most of those plugins are doing work that could be handled in 5% of the code if it were custom-built or consolidated.
What good performance actually looks like
The right benchmarks for 2026 are more demanding than most agencies acknowledge.
Lighthouse mobile score above 90 on the homepage and key landing pages. Not 70-something. Not 80-something. The competitive sites in most categories are at 90+, and that’s the floor.
LCP under 2 seconds on a moderately-fast mobile connection. Two and a half seconds is “passing” but two is competitive. The fastest sites in any category are at 1.2 to 1.5 seconds.
JavaScript bundle size under 200kb on a typical page (compressed). Most sites are at 600kb to 1mb. Reducing this is usually the highest-leverage performance work available.
No layout shift after initial render. A CLS of 0.0 is achievable; aim for below 0.05. The way to get there is mechanical: explicit dimensions on every image and video, reserved space for late-loading content, careful handling of font swaps.
INP under 100ms. Most sites we audit are at 300 to 500ms. Reducing JavaScript execution time, deferring non-critical scripts, and breaking up long tasks gets this to where it should be.
These benchmarks are achievable on virtually any site, in any framework, on any reasonable hosting. The reason most sites don’t hit them isn’t technical. It’s that nobody on the team is treating performance as a measurable, defensible engineering discipline. They’re treating it as something that gets done at the end of a project if there’s time, which there usually isn’t.
The discipline that fixes it
The agencies and in-house teams shipping fast sites in 2026 share one operational pattern: they set a performance budget at project kickoff, and they treat it as non-negotiable. Performance budgets are simple — the page can be no larger than X kilobytes, can use no more than Y JavaScript, must hit Z Lighthouse score — and they’re enforced by automated tooling that fails builds when the budget is exceeded.
Sites built with performance budgets stay fast. Sites built without them slow down inexorably as features are added, marketing scripts are stacked on, and well-intentioned changes accumulate. By the time anyone notices the performance has degraded, the team that originally built the site is gone and the cost of fixing it is high.
For SMEs running their own sites, the right move is to make performance someone’s job — explicitly. Either an in-house engineer with the responsibility, or an agency partnership that makes performance a measurable deliverable rather than a vague claim. Sites that succeed at performance are the ones where someone is accountable for the metrics, and the metrics are reviewed regularly. Sites that fail are the ones where everyone assumes someone else is paying attention.
The good news is that performance work, unlike most marketing investments, has compounding returns. A faster site ranks better, converts better, retains users better, and (because it’s structured better internally) is easier to maintain over time. The work pays for itself in months, not years. Most SMEs we work with see the rankings move within a quarter of fixing performance — and the conversion improvements arrive even faster than that.
If your rankings have been flat or sliding, and your team can’t figure out why, this is the place to look first. Not because it’s the only thing that matters, but because it’s the most common load-bearing problem hidden under everything else.